Makeover Monday 2020 W/4
Makeover Monday 2020 W/4
Makeover Monday is a project in the form of a dashboard that is published by one of the participants and must be redone by anyone who wishes. The dataset example is published weekly on the website.
The theme for week 4 is: Bridges to Prosperity.
Bridges to Prosperity (B2P) works with isolated communities to create access to essential healthcare, education, and economic opportunities by building footbridges over impassable rivers.
Since 2001, B2P has worked with communities in 20 countries to build 318 bridges that collectively provide safe access to 1.1 million people.
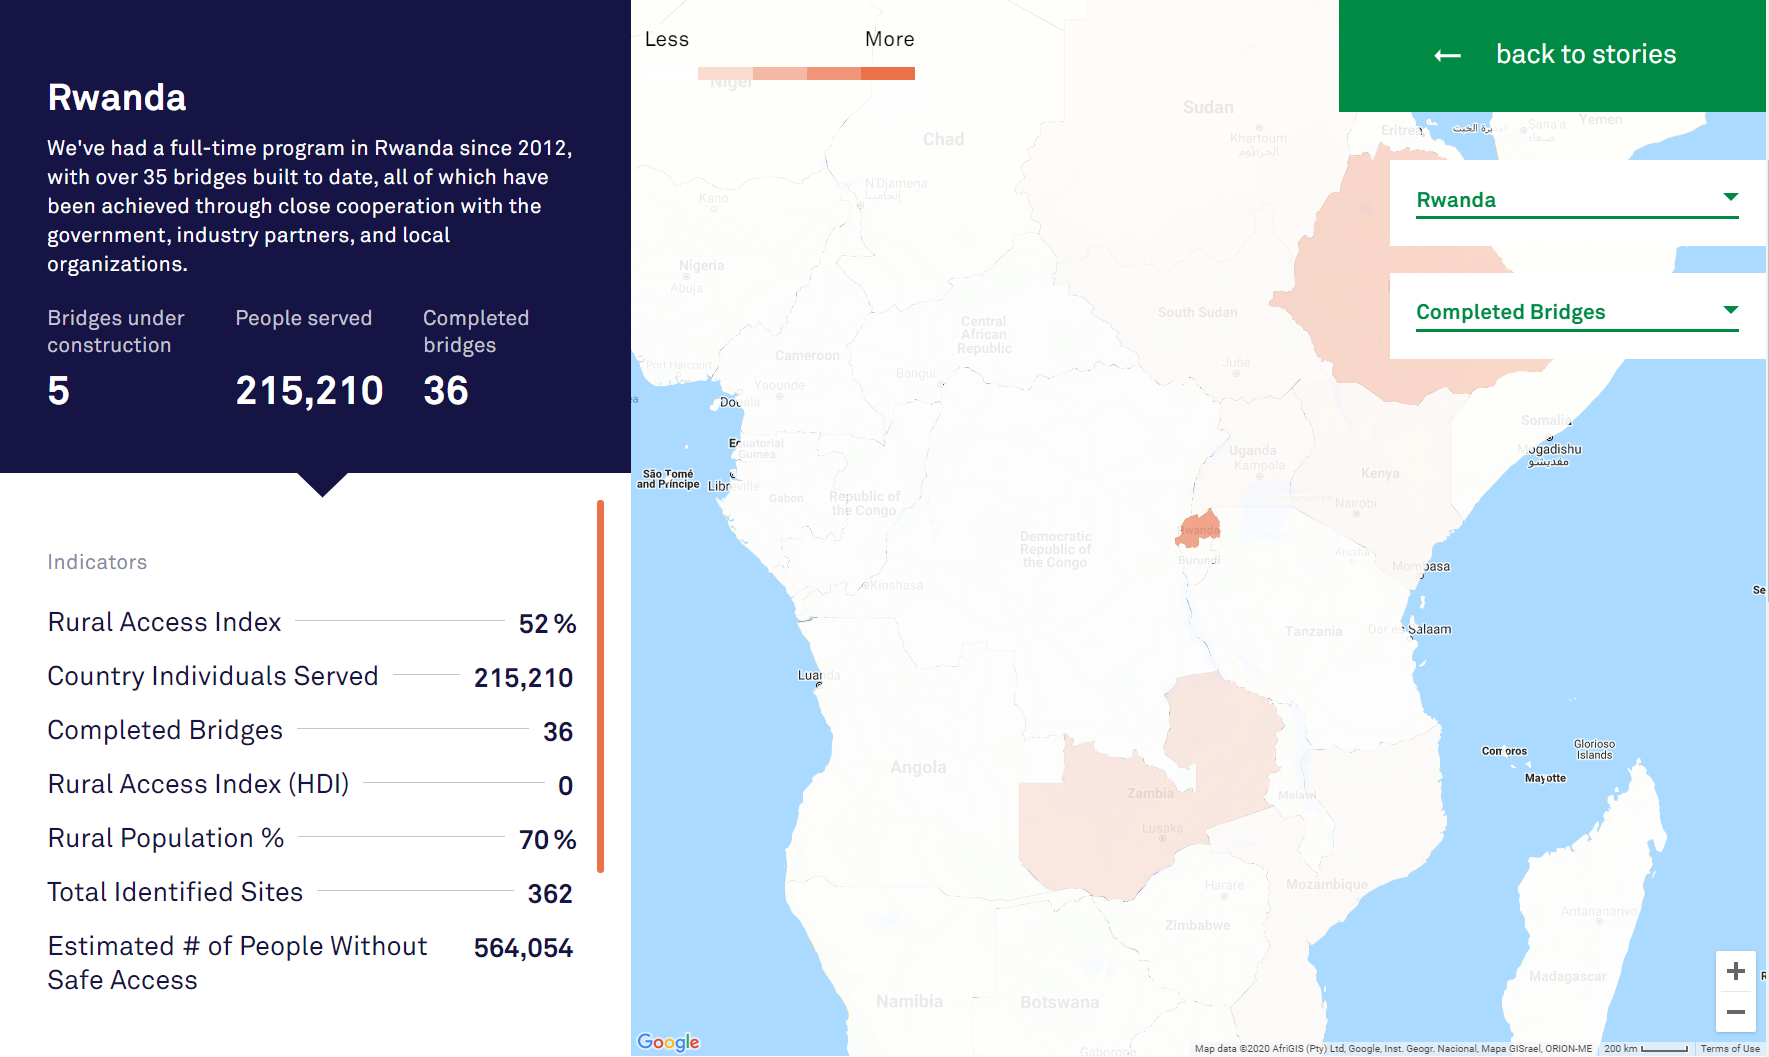
Original Version
You can check out the original version here.
Good practices:
- Use of map
My Version
How did I develop it?
I chose Power BI because it is a tool I am more familiar with and for its ease of external access. The original measure of pesticide use was in pounds, so I performed the conversion by adding a column to give the result in kilograms.
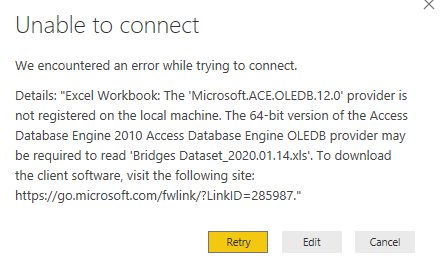
The xls format is designated for older versions of Excel, when we save a file, in pt-br it appears as “Pasta de Trabalho do Excel 97- Excel 2003”
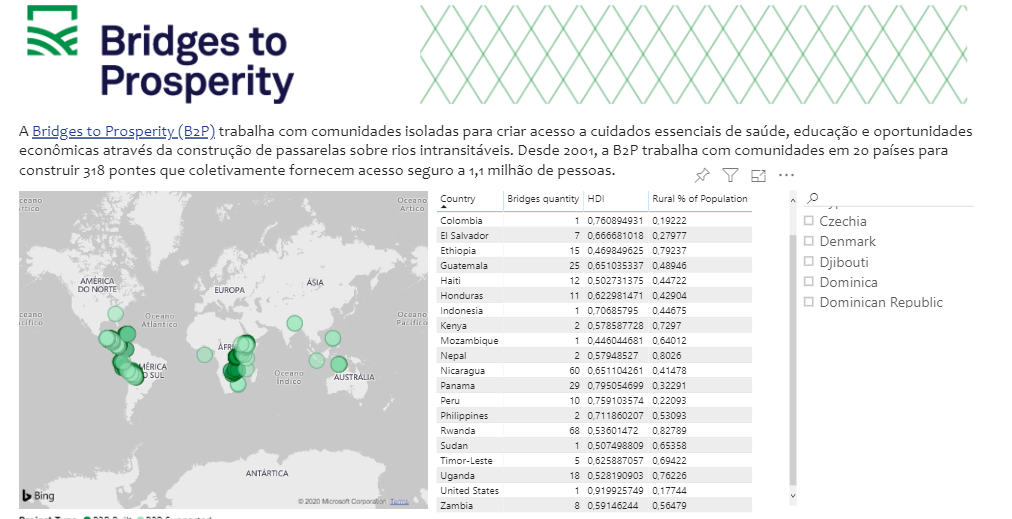
Result
I created measures using DAX to give the individual result of the number of bridges per country. The formula is as follows:
1
Bridges quantity = CALCULATE(COUNTA('Bridges Dataset'[Country]), filter(all('Bridges Dataset'[Country]), 'Bridges Dataset'[Country] = 'Bridges Dataset'[Country]))
Points I wanted to show:
- General map
- Selection by country
- Country statistics


