Makeover Monday 2020 W/2
Makeover Monday 2020 W/2
Makeover Monday is a project in the form of a dashboard that is published by one of the participants and must be redone by anyone who wishes. The dataset example is published weekly on the website.
The theme for week 2 is: Pesticide Use
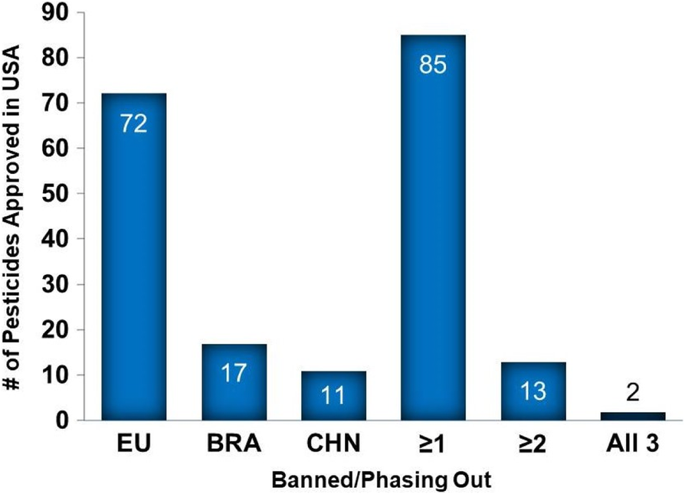
The US lags behind other agricultural nations in banning harmful pesticides. Four of the world’s largest agricultural producers are the USA, EU (European Union), China, and Brazil. Each has separate and distinct pesticide regulatory systems designed to protect, to varying degrees, humans and the environment. A 2016 survey found that 27.3% of pesticides used by the US, amounting to 328 million pounds (approximately 148.7 million kilograms), are banned in at least one of the other nations. There are 85 pesticid…
Original Version
You can check out the original version here.
Good practices:
- Centralized comparison
- Simplified legend
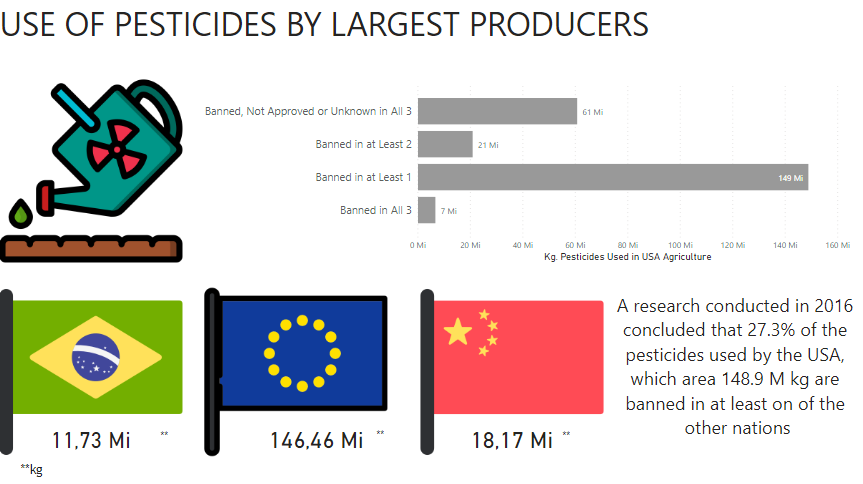
My Version
How did I develop it?
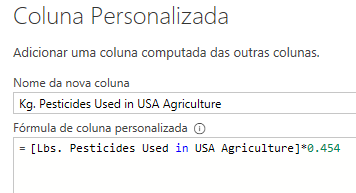
I chose Power BI because it is a tool I am more familiar with and for its ease of external access. The original measure of pesticide use was in pounds, so I performed the conversion by adding a column to give the result in kilograms.
Result
I created measures using DAX to give the individual result using card elements. The formula is as follows:
1
brazil = CALCULATE(SUM(Countries[Kg. Pesticides Used in USA Agriculture]), Countries[Texto Após o Delimitador] = "BRA")
Points I wanted to show:
- Result in kilograms
- Separate comparisons


